


| | | | |
 |  |  |  |  |  |  |
If we look for a suitable period with stable population growth with good statistics, we can look at the population in Europe between 2000-4000ybp. For this period we make a best guess for numbers: stable population growth of 1.05 per generation; a generation length of 30 years and a population near 30 million at 2000 ybp (near 0 CE). This gives a population of 2 million at 2000 BCE. This results at about 2000 Y-DNA branches in 2000 BCE that still have descendants, and about 30000 Y-DNA at 0 CE that have descendants. The ancestors of the large majority of the present population in Europe were living in Europe at 2000 BCE and they were speaking the early versions of the present languages. This means that this area is suitable to compare with the known branch splits.
These branches are the descendants of 5 Y-DNA persons in 5000 ybp: R1b-L151 (4800ybp), R1a-Z283 (4800ybp), I1 (4600 ybp), E-V13 (4900ybp), J2b-Z2507 (below J2b-L283, 4400 ybp) and small groups of descendants of European I2-branches, which survived the arrival of the Indo-European migrants. Additional we have a few other small European branches that survived the arrival of the Endo-European migrants (G). Two other (smaller) Indo-European arriving branch are R1a-CTS4385 (also named R-L664, 4600ybp) and R1b-Z2110 (5300, Balkan, Italy). Almost all of the other lineages probably arrived later.
If we add the numbers of R1b-M269+R1a, I1+I2 (excluding I-L596), E-L618 (=E-V13) and J2-L283 we get the numbers (in arch8.09):
4000ybp: 711+226+56+23=1016
2000ybp: 2922+1160+249+157=4488
0ybp: 7149+3839+451+258=11697
This would suggest that at present about 50 percent at 4000 ybp and about 15 percent of 2000 ybp is present in yfull.
It requires a simulation to check whether these values could be reasonable.
With these numbers we expect, on average, one branch split every 500 years, so every 6 SNP markers (at 82 years per SNP).
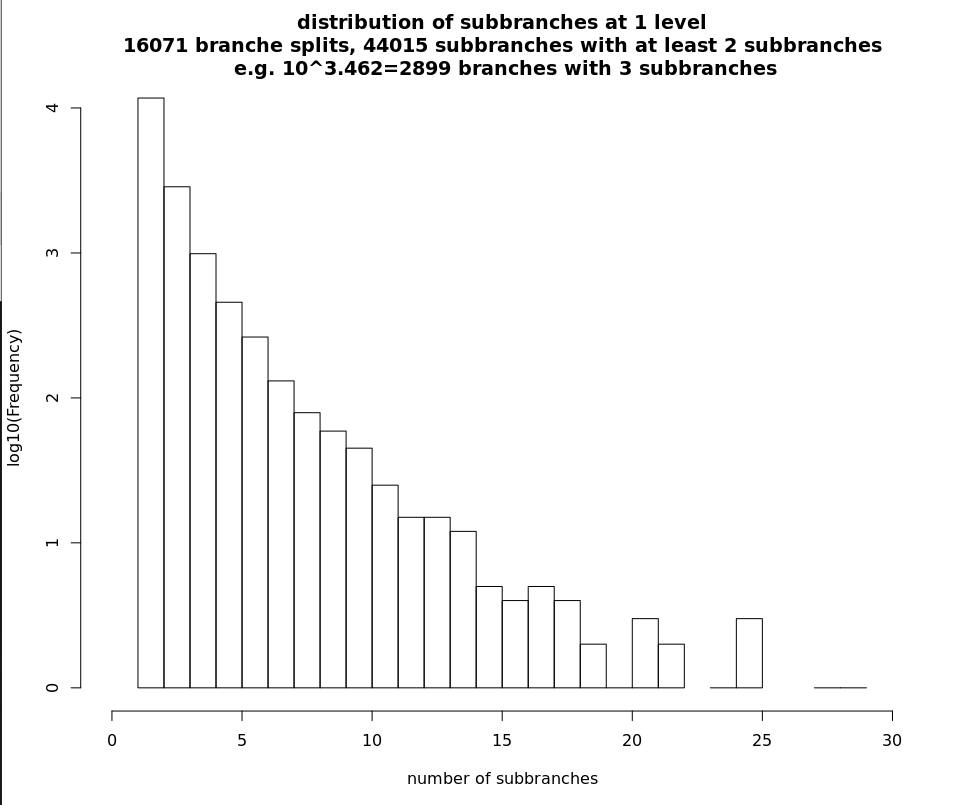
The distribution of number of subbranches for the complete Y-DNA dataset of yfull arch-8.09. The distribution is far from a stable population growth.
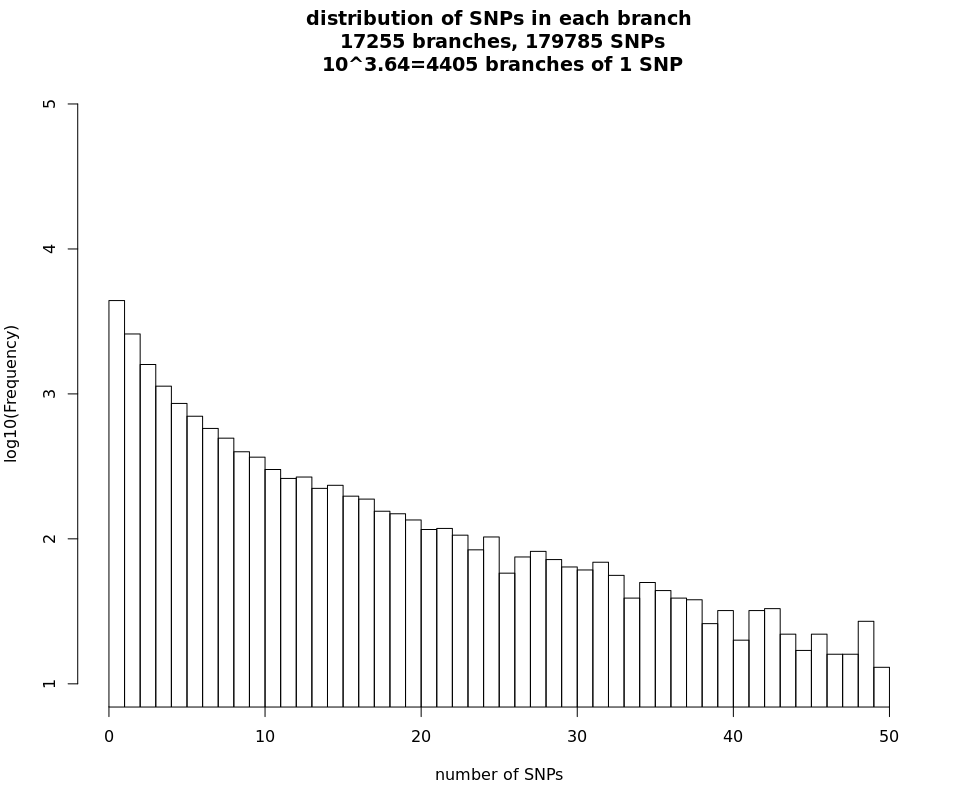
The distribution of number of SNPs in the Y-DNA branches for the complete Y-DNA dataset of yfull arch-8.09. The distribution is far from a stable population growth.