


| | | | |
 |  |  |  |  |  |  |
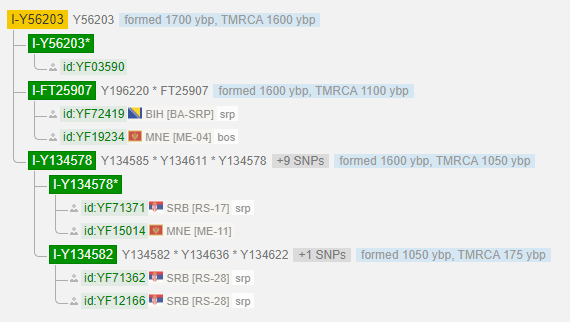
In the maps below you can see the evolution of a small branch I-Y56203 (I2a) in arch-9.04. In the yfull dataset it has 7 samples. One sample has no origin, so it is not used for these time maps.

In case an ancient sample was reported with C14 age information, the time period ends at the age moment of the sample. For kits where living people were measured, the values 60 ybp was used (as is the case in the yfull website). The best value of the time estimate was used. In case the coverage of samples is insufficient and yfull does not report a time estimate (e.g. 1000 genomes project), the number of SNPs is used to determine a minimal time length of the branch, by using 80 years per SNP (see NGS Statistics). In four cases this resulted in negative time estimates. For the location i used a central position in the country in case country was given. In case a province was reported, the central position of the province was used. The countries and positions can be seen on the Positions page.
| R-M269 and R1a | Indo-European, Centum-Satem, Hittite, Greek+Albanian, Baltic, Slavic, Celtic etc. |
| I1, I2 | old European and Northern Europe |
| G | the old Anatolian agricultural branch |
| E-M35 | Afroasiatic, Semitic, E-V22 (Egyptian agriculture) and E-V13 (Greek) |
| A, B, E | Old branches, Bantu expansion and languages |
| J2a | Fertile Crescent, development of cities |
| J2b | Fertile Crescent, development of cities |
| J1 | Fertile Crescent, development of cities |
| T | Fertile Crescent, development of cities |
| Q | Asia and America |
| H | India |
| L | Persian Gulf and Arabian Sea |
| O | Asian |
| N | Uralic (including Finnic) |
| R1b-old | parallel branch to R1b-M269 |
| R2 | Persian Gulf and Arabian Sea |
| C and D | old branches, few surviving descending lines |
| M and S | Australia |
| Britain | Britton, Anglosaxon (R-L21, R-U106, I1) |
| Slavic | The growth of the early Slavic languages (e.g. I-Y56203) |
| Maghreb | Cathage, Berber (before Arab Conquest) |
| Arabia (in prep.) | Main branches in Arabia, continuous growth (E-M35) and a pop. jump (J1-FGC11) |
| World | branches in the world in time |